Types of the scales of measure
Measuring social characteristics >> Scales of measure > Alternative classifications | Scales of measures and statistical methods >> Descriptive statistic
Thanks to Stanley Stevenson we operate several types of scales in our research practice. Some criticize this typology, but judging from all the evidence no one has come up with anything better.

Dembitskyi S. Types of the scales of measure [Electronic resource]. - Access mode: http://www.soc-research.info/quantitative_eng/5.html
Regardless of the complexity of survey questions or test procedure you consider, all of them can be divided into three types depending on the scale of measure they belong to. In this case we are not speaking about specific techniques of construction of measuring instruments (such as the Guttman scale or the Thurstone scale), but about the classification of scales of measure proposed by Stanley Stevens in 1946. Knowledge of this classification is crucial in terms of quantitative approach, since the application of various methods of mathematical statistics is based, among others, on the scales of measure which display the variables of interest.
A "variable" is a frequently used concept in scientific research (not only in social and behavioral sciences), and especially if we are talking about the quantitative approach and application of statistical methods. In fact, a variable is any property of the studied objects, which varies from one observation to another. Observations in this case refer to the objects under study (people, organizations, countries or anything else, depending on the research).
If a property does not changed from one observation to another, it provides no valuable information in the mathematical sense (most methods would simply be inapplicable). Thus, within the quantitative approach the objects under study are represented as a set of researchable o variables of interest. It is not hard to guess that variables are primarily divided according to scales on which they are reflected. So, we can distinguish, for example, between nominal, ordinal and metric variables. In their turn, ordinal variables can be divided into discreet and continuous. Continuous ordinal variables have many numerical values and look (at least at first glance) like metric. Discreet ordinal variables have only a few categories or numerical values (no more than five or six). They can be obtained either by data collection in discreet form or by folding continuous or ordinal metric scale.
Another important division of variables is the division into dependent and independent. In the course of the analysis, the hypotheses about the influence of some variables on the other are often put forward. In such cases, the influencing variables are called independent, and the variables influenced are called dependent. For example, if we speak about the correlation between students’ gender and efficiency of their education, then gender will be an independent variable, and education efficiency – a dependent one.
According Stevenson’s classification, in its most general form, we can distinguish between three types of scales:
- nominal,
- ordinal,
- metric.
- nominal,
- ordinal,
- metric.
A nominal scale includes a class of variables which can be divided into groups but cannot be ranked. Examples of such variables are gender, nationality, religion, etc. Let us consider in detail nationality as a variable. In this case, the respondents can be divided into different groups depending on the nationality with which they identify themselves. However, based on this information, the respondents can not be ranked in terms of quantity of the parameter of interest, because nationality is not a measurable property, at least in the traditional sense.
An ordinal scale includes a class of variables which can not only be divided into groups, but also be ranked depending on the intensity of the measured property. A classical example of an ordinal scale is the Bogardus scale designed to measure national distance. Its version adapted for the population of Ukraine (by N. Panina, E. Golovakha) is presented below:
An ordinal scale includes a class of variables which can not only be divided into groups, but also be ranked depending on the intensity of the measured property. A classical example of an ordinal scale is the Bogardus scale designed to measure national distance. Its version adapted for the population of Ukraine (by N. Panina, E. Golovakha) is presented below:
Questionnaire Task
For each nationality below, select one of the positions closest to you personally, to which you would admit the representatives of this nationality:
...
Scale responses
1) as members of my family;
2) as close friends;
3) as neighbours;
4) as colleagues;
5) as residents of Ukraine;
6) as visitors of Ukraine;
7) would not admit to Ukraine at all.
This scale allows us to organize the respondents according to their attitude towards a particular nationality. However, it provides only approximate information that does not enable us to accurately assess the differences between the scale gradations. For example, we can say that a respondent willing to admit Jews as members of their family will treat them better than a respondent willing to admit them only as neighbours. However, we can not say how much better the former respondent treats the representatives of the Jewish nationality than the latter. In other words, we do not have any evidence that would confirm the equality of intervals between the scale points.
A metric scale includes a class of variables which can be divided into groups and be ranked, and whose value can be determined in precise terms (the above mentioned "how much?"). Typical examples of such variables are age, salary, the number of children, etc. Each of them can be measured as accurately as possible: age – in years, salary – in UAH, the number of children – in persons).
Naturally, if a variable can potentially be expressed on a metric scale, then the same variable can be expressed on an ordinal one.
For example, age can be expressed in age groups (youth, middle aged, elderly), which give only approximate information about the respondent, despite the possibility of their ranking.
The fact that a variable belongs to a metric scale opens up the possibility of applying any statistical methods. In their turn, ordinal or nominal scales limit the choice of mathematical techniques (less so for ordinal, more so for nominal). Classification of statistical methods can be found here.
To make the differences between nominal, ordinal and metric scales even more apparent, I will cite an additional example related to professional heavyweight boxers, according to boxrec.com (information is current as of 31.01.2012). Here we will consider three variables for the top ten boxers: boxer’s ethnicity, his rating and the number of rating points he had as of 31.01.2012.
A) Ethnicity (nominal scale). Three boxers (the Klitschko brothers and Dimitrenko) are Ukrainians, one (Povetkin) is Russian, one (Adamek) is Polish, two (Chambers and Thompson) are Americans, one (Fury) is British, one (Helenius) is Finnish, one (Pulev) is Bulgarian. Thus, the variable "nationality" has helped us to divide all boxers into 7 groups according to their ethnicity. With these data, a person far from boxing can say nothing about the success of these boxers, though he/she receives information on the ethnicity of 10 best heavyweights (we will continue to refer to this hypothetical expert):
Ukrainians – 30%;
Americans – 20%;
Russian, Polish, British, Finns and Bulgarians – 10%.
B) Rating (ordinal scale) gives approximate information about the success of a boxer. The situation is as follows:
1. Wladimir Klitschko
2. Vitali Klitschko
3. Alexander Povetkin
4. Tomasz Adamek
5. Eddie Chambers
6. Tyson Fury
7. Robert Helenius
8. Tony Thompson
9. Alexander Dimitrenko
10. Kubrat Pulev
Now our inexperienced analyst knows the sequence of the top ten heavyweight boxers. Although here we already have numbers from 1 to 10, he/she still cannot perform any mathematical operations except comparison. For example, he/she cannot say that Wladimir Klitschko is better than Eddie Chambers by 4 points. The expression "5 minus 1" in this case does not make any sense. Of these two boxers he/she can only say that Wladimir Klitschko is better as a boxer than Eddie Chambers (as well as than all the rest of the top ten). The reason for the impossibility of mathematical operations is that there is no equality of intervals between points from the 1 to 10. The actual intervals between points can be seen via the last variable.
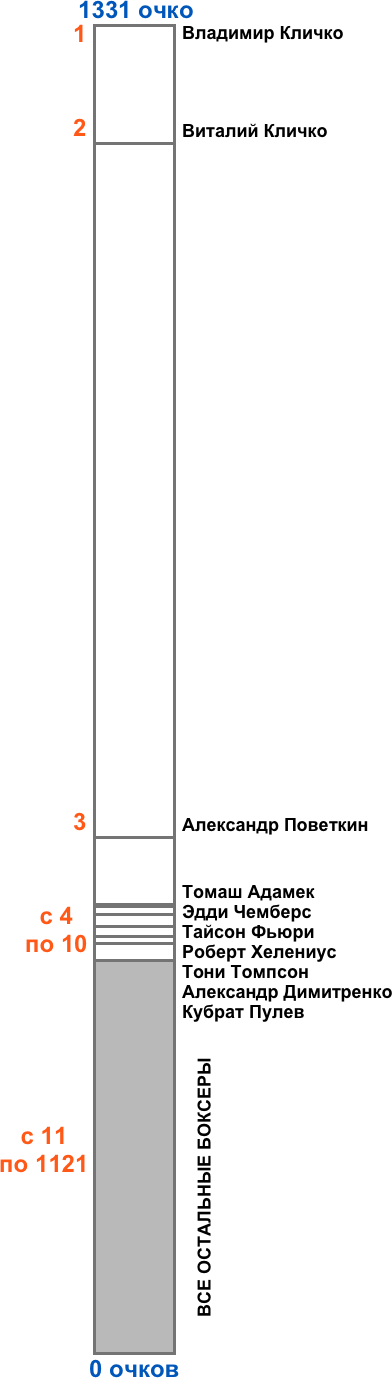
B) The number of rating points (metric scale). This index is calculated with a special formula, which is based on rating of the opponents and the results of the respective fights (knockout, technical knockout, victory by unanimous decision, etc.). As a result, the measure of boxers’ success is much more accurate than their mere place in the rating. Corresponding points are given below:
Our inexperienced boxing analyst will be very much surprised by how much new information this variable tells him/her. Of course, the interval equality between points of the "rating" variable is out of the question. For example, there is a huge gap between the 2nd and 3rd place, while the points between the 4th and 10th places are close. Therefore, an accurate description of the differences between boxers’ success in sports is only possible with the use of the last variable.
The graph below illustrates the rating of boxers according to the last variable (click to enlarge):
Rating |
Boxer |
Number of Rating Points |
1 |
Wladimir Klitschko |
1331 |
2 |
Vitali Klitschko |
1213 |
3 |
Alexander Povetkin |
519 |
4 |
Tomasz Adamek |
452 |
5 |
Eddie Chambers |
450 |
6 |
Tyson Fury |
442 |
7 |
Robert Helenius |
430 |
8 |
Tony Thompson |
420 |
9 |
Alexander Dimitrenko |
413 |
10 |
Kubrat Pulev |
396 |
The graph below illustrates the rating of boxers according to the last variable (click to enlarge):
- default_titleХили Дж. Статистика. Социологические и маркетинговые исследования. - К.: ООО "ДиаСофтЮП"; СПб.: Питер, 2005. - 638 с.
- default_titleПаніна Н. Технологія соціологічного дослідження. - К.: Інститут соціології НАН України, 2007. - 320 с.
- Show More